
Greater Sydney short-term rental report 2026
Your Sydney property could earn more. See how short-term rental income compares with a long-term lease—and where the opportunities are in 2026.
By MadeComfy
Your Sydney investment property could earn more as a professionally managed short-term rental. Across the seven two-bedroom markets compared in this report, annual short-term revenue estimates exceed the long-term rent references by $23,500–$35,200 before costs. That is a meaningful reason to explore what your own home could earn.
We see worthwhile opportunities for Sydney property investors in 2026. City apartments have attracted bookings through winter, coastal homes command premium nightly rates, and three- and four-bedroom revenue has held steady. This report shows where the income is coming from and how to assess the opportunity for your home.
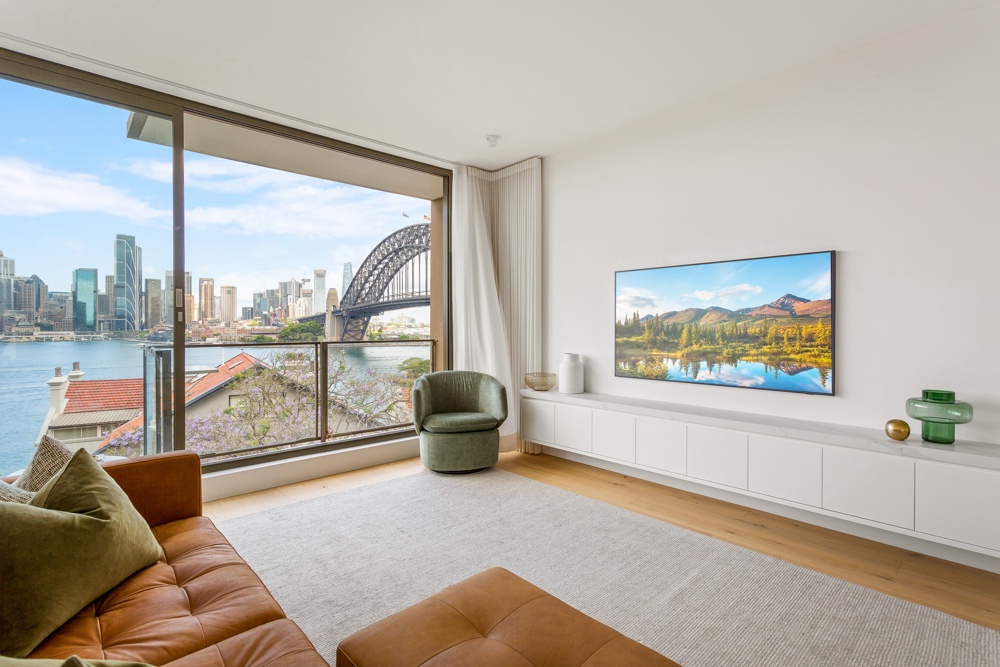
Short-term versus long-term rental income by property size
This table compares estimated annual revenue from professionally managed entire homes in Sydney with long-term rents across Greater Sydney. Both include all property types within each bedroom group. Long-term figures use the NSW rental-bond medians for the June quarter, multiplied by 52.
| Property size | Professionally managed STR average | Annualised long-term median | Gross difference before costs |
|---|---|---|---|
| Studio | $54,374 | $27,560 | +$26,814 |
| 1 bedroom | $60,233 | $35,880 | +$24,353 |
| 2 bedrooms | $74,949 | $39,520 | +$35,429 |
| 3 bedrooms | $97,943 | $41,600 | +$56,343 |
| 4+ bedrooms | ≈$142,000 | $49,400 | ≈+$92,600 |
Gross market benchmarks in Australian dollars, before owner costs. Short-term figures cover the year to August 2026 and include cleaning charges; long-term rents assume 52 paid weeks. Studios use the long-term bedsitter category. Four-plus bedrooms includes larger homes and is approximate. Property mix, availability and geographic coverage differ, so these gaps do not measure the same home under both rental options.
Smaller apartments deserve attention. Studios and one-bedroom properties had annual short-term revenue estimates of about $54,400 and $60,200, with occupancy of 77% and 75%. They also have less space to furnish and maintain. An appraisal can be worthwhile even if you own a compact apartment.
Three-bedroom homes reached about $97,900 a year. The four-plus-bedroom group averaged approximately $142,000 at 55% occupancy, though it includes much larger homes. For your own home, layout, bathrooms and location help identify the most relevant comparisons.
See what your property could earn
Get an instant estimate of your property’s monthly gross income with MadeComfy. Our team can then assess your home, expected costs and available dates with you. For comparison, $1,050 a week in long-term rent is $4,550 a month, assuming 52 paid weeks.
Two-bedroom rental income across seven Sydney locations
Location changes the picture. Across these seven areas, the professionally managed two-bedroom short-term estimates exceed the long-term rent references by $23,500–$35,200 a year before costs.
The comparison uses professionally managed two-bedroom entire homes and median new-lease rents for two-bedroom flats and units from the NSW rental-bond data for the June quarter.
| STR market / LTR postcode | Professionally managed STR | Annualised long-term median | Gross difference |
|---|---|---|---|
| Sydney–Haymarket–The Rocks / 2000 | ≈$105,000 | $72,800 | ≈+$32,200 |
| Bondi Beach–North Bondi / 2026 | $92,400 | $57,200 | +$35,200 |
| North Sydney–Lavender Bay / 2060 | $84,400 | $49,400 | +$35,000 |
| Manly–Fairlight / 2095 | $83,300 | $59,800 | +$23,500 |
| Pyrmont–Ultimo / 2009 | $84,300 | $54,600 | +$29,700 |
| Surry Hills / 2010 | $80,800 | $57,200 | +$23,600 |
| Parramatta–Rosehill / 2150 | $61,700 | $36,400 | +$25,300 |
Gross market benchmarks in Australian dollars, rounded to the nearest $100; the CBD figure is approximate. Short-term revenue includes cleaning charges; long-term rents assume 52 paid weeks. These are averages and medians for different groups of homes and areas. The difference is before owner costs, rather than a measured improvement for the same property.
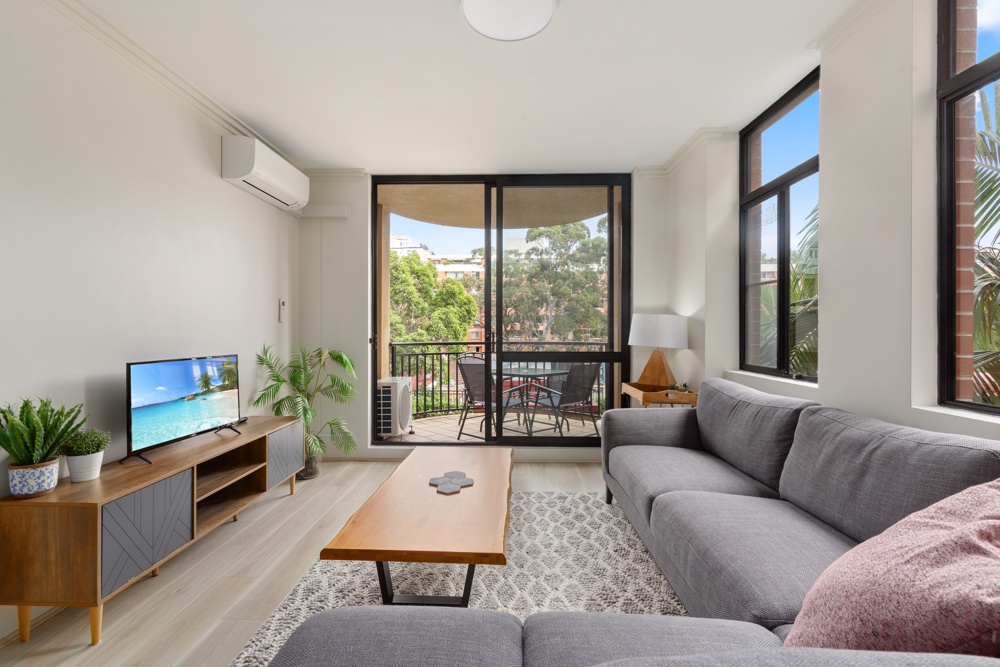
Pyrmont: close to $30,000 more gross income
Professionally managed two-bedroom homes in Pyrmont–Ultimo had an annual revenue estimate of about $84,300. Two-bedroom flats and units in postcode 2009 had a median new-lease rent of $1,050 a week, or $54,600 over a fully paid year. The gross gap is roughly $29,700 a year—$570 a week.
Preparing the home matters. In our Pyrmont case study, Eva’s two-bedroom Darling Harbour apartment was furnished, styled and professionally photographed for business and leisure guests, with dynamic pricing used once it was on the market.
A work area, reliable internet and laundry facilities can make an apartment more practical for longer stays. Your MadeComfy Sydney team can help plan the presentation and practical details, from furnishing and photography to access and parking information for guests.
Is short-term letting worth it in Sydney?
The Pyrmont comparison shows why a switch can be worth exploring: an illustrated $16,700–$18,900 annual advantage after management fees, before other costs. Using the market figures above, here is how the two options compare.
| Annual income comparison | Short-term letting | Long-term lease |
|---|---|---|
| Estimated gross income | $84,300 | $54,600 |
| Estimated income after management fees | ≈$67,400–$69,100 | ≈$50,200–$50,800 |
Illustrative, rounded figures after management fees only. Separately charged platform or letting fees, cleaning and linen, utilities, insurance, maintenance, replacement furnishings, any additional GST, borrowing costs and tax remain to be deducted where applicable. Short-term revenue includes guest cleaning charges, so the corresponding expense must be included. Initial furnishing costs are additional.
Our team can prepare a forecast for your apartment that sets out expected income, what management covers and any separate expenses. You can then see how the short-term option compares with a current long-term rental appraisal.
The example retains a potential income advantage against a stronger long-term rent. At the upper-quartile rent of $1,200 a week for two-bedroom units in postcode 2009, the same short-term estimate and management allowances still leave an illustrated difference of $9,400–$11,700 a year before other costs.
Sydney property market in 2026: rates, prices and rents
The RBA’s September increase took the cash rate to 4.60%, a full percentage point above the start of the year. Meanwhile, Sydney dwelling values were 7.1% below their February peak by August, according to Cotality. For existing owners, making more of the property’s rental potential is one way to respond to higher holding costs.
For buyers, a lower purchase price improves rental yield at the same income. The opportunity depends on the combination of purchase price, achievable rent and financing costs.
Long-term rents have risen too. Domain’s June-quarter report put Sydney’s median advertised house rent at $850 a week and unit rent at $780, up 6.3% and 4.0% over the quarter. Those figures cover all bedroom sizes. A current long-term appraisal gives your property a relevant benchmark for the comparison.
Tenants have a little more choice. SQM Research reported Sydney’s vacancy rate at 1.7% in August, up from 1.4% a year earlier. That remains a tight rental market, despite the increase in availability.
Additional rental income can help meet higher holding costs. For scale, a one-percentage-point rise in the actual rate on an $800,000 interest-only loan adds about $667 a month, assuming the balance stays unchanged. Your mortgage rate may move differently from the cash rate; use your actual repayments in either rental budget.
Sydney short-term rental market performance in 2026
Across Sydney’s wider entire-home market, annual revenue was estimated at $67,403, down 1.4% on the previous year and broadly level with two years earlier. The three annual results sit within about $1,000 of each other.
| Year | Annual revenue benchmark | Change |
|---|---|---|
| 2024 | $67,338 | — |
| 2025 | $68,357 | +1.5% |
| 2026 | $67,403 | −1.4% |
Entire homes, all bedroom sizes. Each year ends in August. Annual benchmarks add monthly average revenues from booked listings, before owner costs.
August finished with 69.0% occupancy, a $300 average daily rate and $5,447 average listing revenue. Nightly rates were 2.4% higher than a year earlier, although monthly revenue was 2.4% lower.
The median monthly revenue was $4,682, about $765 below the average. Higher-earning homes pull the average up, so it can overstate what a typical property receives.
Sydney occupancy rates and seasonal rental income
February was a bright spot. Occupancy rose from 73.8% to 78.6%, the average daily rate edged up to $330 and revenue increased 5.2%. October and November also improved, with revenue growth of 5.8% and 2.7%.
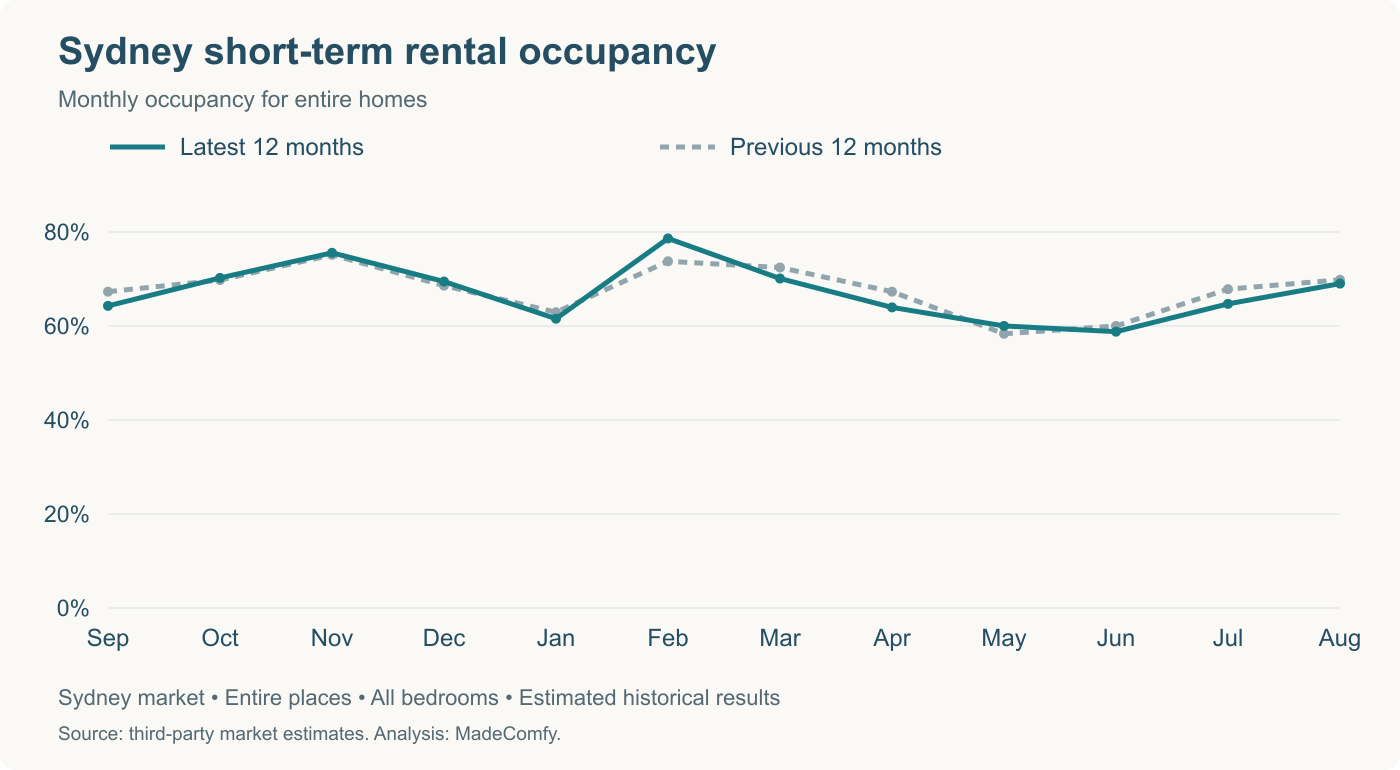
November brought the highest revenue at $6,893 per listing. December had the highest nightly rate, $390, but slightly lower revenue of $6,687. A well-booked spring can be every bit as valuable as Christmas.
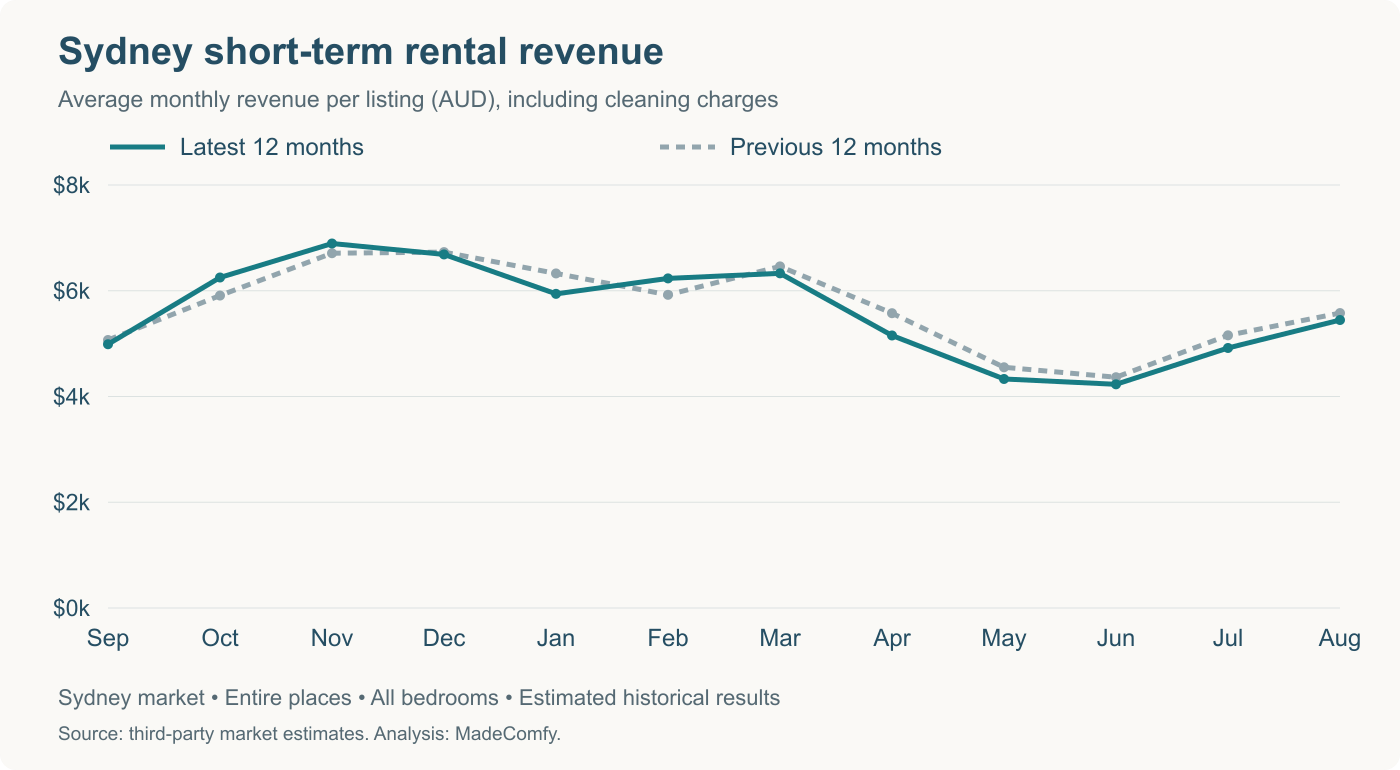
Spring and summer supplied 55% of annual revenue; winter contributed almost 22%. The quieter months still matter. At MadeComfy, we adjust pricing to local demand, seasonality and booking length, weighing a longer stay against the shorter bookings it would replace.
Vivid Sydney ran for 23 nights across May and June, yet citywide occupancy was around 60% and 59% in those months—the quietest of the year. Those figures show why the full winter booking plan matters alongside event-night pricing.
Sydney suburb comparison: two-bedroom short-term rentals
The next table looks beyond professionally managed homes to the wider two-bedroom entire-home market across 13 Sydney locations. It shows how occupancy and nightly rates combine to produce quite different annual incomes.
| Location | Occupancy | Daily rate | Annual revenue | Active listings |
|---|---|---|---|---|
| Sydney–Haymarket–The Rocks | 76% | $407 | ≈$103,000 | 410 |
| Bondi Beach–North Bondi | 70% | $405 | $86,700 | 205 |
| North Sydney–Lavender Bay | 70% | $363 | $81,500 | 56 |
| Manly–Fairlight | 66% | $418 | $81,500 | 147 |
| Pyrmont–Ultimo | 70% | $356 | $80,100 | 117 |
| Potts Point–Woolloomooloo | 69% | $369 | $79,800 | 68 |
| Darlinghurst | 69% | $365 | $79,500 | 69 |
| Surry Hills | 72% | $346 | $78,300 | 115 |
| Coogee–Clovelly | 73% | $352 | $77,300 | 100 |
| Chatswood (East)–Artarmon | 73% | $305 | $73,700 | 45 |
| Newtown–Camperdown–Darlington | 69% | $300 | $68,200 | 69 |
| Randwick | 70% | $293 | $65,100 | 26 |
| Parramatta–Rosehill | 68% | $240 | $55,000 | 92 |
Wider-market figures for two-bedroom entire homes, across all property types. Annual revenue is rounded to the nearest $100; the CBD figure is approximate. Active listings had a booking in August. These are selected markets, not a ranking of every Sydney suburb.
CBD, Haymarket and The Rocks: strong occupancy and revenue
Central Sydney paired 76% occupancy with a $407 average daily rate, producing the highest annual revenue estimate in this comparison: approximately $103,000. Manly charged slightly more per night. The CBD filled more of its available calendar.
A city apartment can appeal to both business and leisure guests if the layout works for them. Separate beds, convenient transport and a usable living area are worth considering when you furnish it.
Bondi, Coogee and Manly: the coastal rate premium
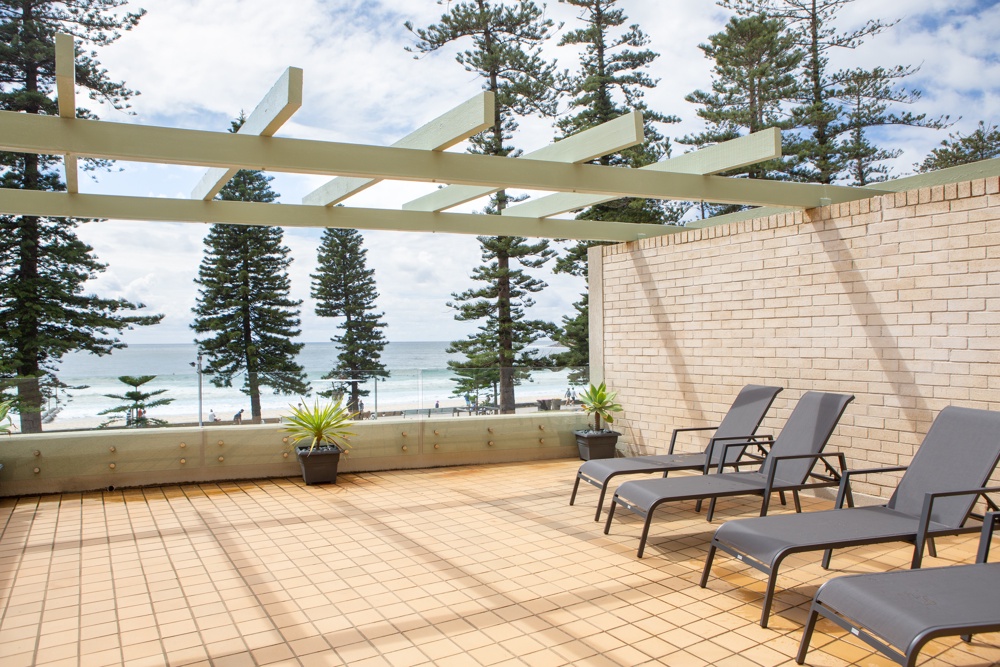
Manly–Fairlight had the highest daily rate at $418, followed by the CBD and Bondi. Coogee–Clovelly charged less at $352 but filled more of its available nights: 73%, against Bondi’s 70% and Manly’s 66%.
Bondi led the three coastal markets on annual revenue. If you use your beach property yourself, choose those weeks with care: keeping a prime summer week has a different income cost from a winter visit.
Pyrmont, Surry Hills and the inner east
Pyrmont–Ultimo, Surry Hills, Darlinghurst and Potts Point–Woolloomooloo clustered around $78,300–$80,100 in annual revenue. Surry Hills had the highest occupancy of the four at 72%; Potts Point–Woolloomooloo had the highest daily rate at $369. Similar yearly income, reached in different ways.
North Shore, Inner West and Parramatta
North Sydney–Lavender Bay’s annual revenue estimate was about $81,500, close to Manly, through a lower nightly rate and higher occupancy. Chatswood East–Artarmon reached 73% occupancy. Both offer useful North Shore comparisons, though fewer listings make individual homes more influential in the results.
Newtown–Camperdown–Darlington and Parramatta–Rosehill had lower gross income estimates than the city and coastal markets. That does not establish a lower investment yield: purchase price and running costs also matter.
Winter occupancy: where city properties held up best
Winter helps explain the CBD’s annual result. Two-bedroom occupancy in Bondi and the CBD was almost level in February, at around 86%. By June, the CBD was at 66%—roughly 15 percentage points above Bondi and 17 above Manly.
| Location | November | February | June | August |
|---|---|---|---|---|
| CBD, Haymarket & The Rocks | 82.4% | 86.4% | 66.2% | 80.5% |
| Pyrmont–Ultimo | 80.8% | 85.4% | 57.5% | 77.2% |
| Surry Hills | 82.0% | 86.3% | 60.5% | 73.6% |
| Bondi Beach–North Bondi | 79.7% | 86.5% | 51.2% | 66.0% |
| Manly–Fairlight | 76.5% | 80.9% | 49.6% | 64.2% |
| Parramatta–Rosehill | 74.2% | 76.2% | 65.9% | 69.3% |
Monthly occupancy for two-bedroom entire homes. The selected months show spring, February, early winter and late winter; they are not seasonal averages.
Parramatta also held close to 66% occupancy in June. By August, the CBD had reached 81%, Pyrmont 77% and Surry Hills 74%. Bondi and Manly remained in the mid-60s.
The city’s late-winter recovery is encouraging. It also argues against using one rate for the whole winter. A longer coastal booking may be worthwhile at a lower nightly rate if fewer changeovers and gaps leave you ahead of the shorter stays it would replace.
How rental income changed by property size
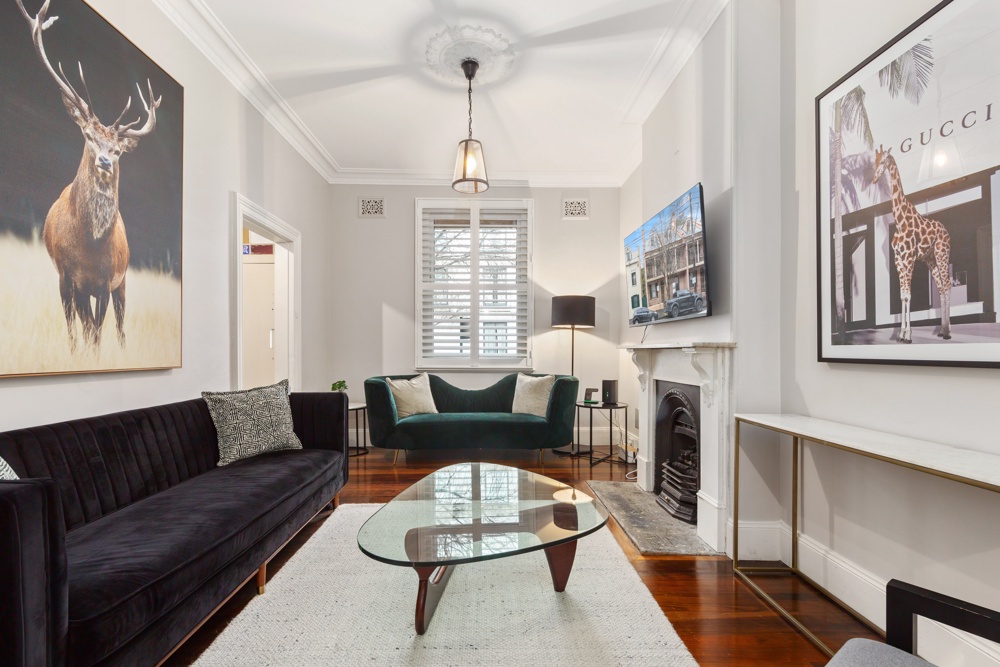
In the wider Sydney market, three- and four-bedroom homes held annual revenue broadly steady. One- and two-bedroom properties slipped modestly. These figures include all entire homes, alongside the professional-management comparisons earlier in the report.
| Property size | Annual revenue | Annual change |
|---|---|---|
| 1 bedroom | $50,578 | −0.6% |
| 2 bedrooms | $66,817 | −2.3% |
| 3 bedrooms | $84,417 | +0.7% |
| 4 bedrooms | $108,125 | +0.1% |
| 5 bedrooms | $116,818 | −4.8% |
| 6+ bedrooms | $144,735 | −1.6% |
Sydney entire-home market. Gross annual revenue benchmarks include cleaning charges and are calculated from monthly averages.
Three-bedroom homes generated about $17,600 more gross revenue than two-bedroom homes; four-bedroom homes added a further $23,700. That extra income has to justify a larger purchase, furnishing bill and ongoing costs.
The largest homes had a softer year. Five-bedroom revenue fell 4.8%, while six-bedroom-plus homes were down 1.6%.
Sydney’s 180-day rule and proposed rental restrictions
Under the current NSW planning framework, non-hosted short-term rentals using the exempt development pathway in Greater Sydney are generally limited to 180 days within their annual registration period. Bookings of at least 21 consecutive days are excluded from the count. Check registration, fire safety requirements, development consent and strata by-laws for your address.
Occupancy is the share of available nights booked; blocked dates are excluded. Build your forecast around your legal allowance, owner stays and expected booking lengths. Our team can help plan that mix, including qualifying medium-term stays where there is demand for them.
City of Sydney’s April 2026 resolution sought advice on possible time-limited bans for non-primary residences, suburb restrictions and a link to rental vacancy rates. It did not introduce a ban or a vacancy-rate threshold.
Tax changes to factor into a purchase
Buying an investment property also means accounting for the negative-gearing and capital-gains tax changes from July 2027. Acquisition timing, new-build status and transitional rules affect the treatment. Have your accountant assess the purchase and intended rental use before relying on deductions to support the cash flow.
Our outlook for Sydney property investors
Our outlook is positive for homes that meet a clear guest need throughout the year. The CBD’s winter bookings, coastal nightly rates and steady income from three- and four-bedroom homes show the different opportunities available to Sydney owners. Good presentation and a booking strategy suited to the location are central to making the most of them.
Sydney has a broad base of travel demand. The airport recorded 17.17 million international passenger movements in 2025, and Destination NSW reported more than 4.7 million business-event visitors to Sydney. Passenger movements count arrivals and departures, including residents, while business-event visitors include day trips. Your opportunity depends on who needs to stay nearby.
Where we see opportunity
- City apartments: the CBD’s stronger winter occupancy supports a closer look at homes near business and visitor destinations, particularly those equipped for longer stays.
- Coastal homes: premium summer rates can support a strong year, with winter bookings and the weeks you reserve for yourself shaping the result.
- Three- and four-bedroom homes: steady revenue makes these sizes worth considering for owners with space to accommodate families and groups.
With MadeComfy, you have a team to put that plan into practice. We help prepare and present your property, manage listings and bookings, adjust pricing to demand, and coordinate guest communication and housekeeping. You can explore the income opportunity with professional support from setup through to ongoing management.
See what your Sydney property could earn with MadeComfy. Start with an instant income estimate, then let our team work through the income, costs and available dates with you.
Gross rental income per month as a professionally managed short-term rental
Learn MadeComfy does it